
Vector-Charts
We use vector-charts. You wonder why?
After all, raster-charts are what we are used to in the US. They are Nautical Charts simply scanned and “transposed” into digital memory. They are easy to produce and they make us feel “at home”.
But what happens if we are sailing South and we want a Course Up display? All the writing and information is upside down. A bit uncomfortable...
Again, what happens if we are sailing in a complicated area full of bathymetric lines, forbidden zones, light houses, buoys and more and more? Again… it’s confusing but we feel at home. That is what happens with a physical Chart.
Let’s re-examine this, we are in the third millennium, we can do better, much better, by using vector charts. They are more difficult to produce but this only matters to instrument makers or specialized electronic charting companies.
In contrast to Raster charts, Vector charts are wonderfully flexible. Let’s see some examples.
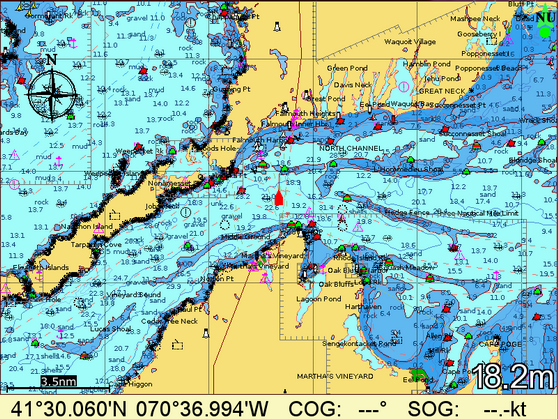
This is a complicated zone containing more information than we might need. It could be confusing.
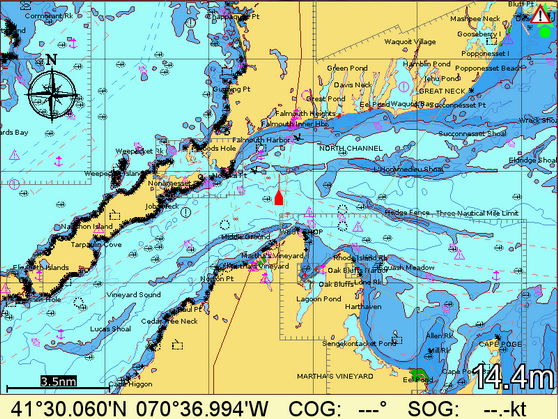
What if we just want to see the bathymetric lines better? We can hide the spot soundings, buoy, lights and bottom type.
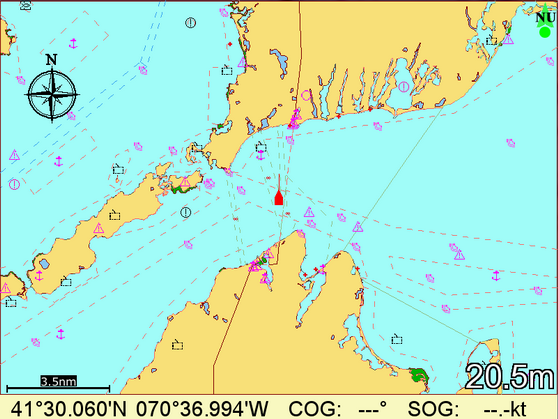
Do we want to see in a clearer way the traffic zones? Here they are.
And now we display the place names and we sail 120° in Course Up mode.
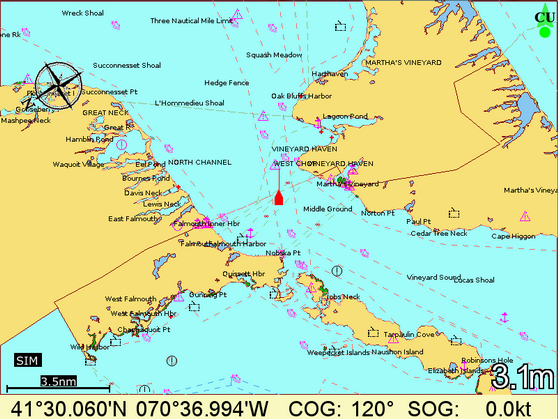
The writing is right-side-up. We don’t need to go crazy trying to understand what is on the screen. So cool!
These are just examples. A good captain would leave some more information on the screen: for example, you might always want buoys and lights to be displayed. What is important is the extreme flexibility of vector-charts versus raster-charts.
Now, are you still sure that raster charts are the best choice?
Perhaps not. Yet, you may want to discuss this with us a bit more or other marine navigation matters.
If so, you can write us using the form or join us on Facebook. In any case you are welcome.